
MLB Trends - Part I: Stadiums
“You can observe a lot by just watching” - Yogi Berra

Aside: Supreme Court Repeals PASPA
Anyone with even a shoddy internet connection could not help but run into this news from last week: http://time.com/5280442/supreme-court-sports-betting-repeal/

The U.S. is about to plunge headfirst into a Wild West era of sports wagering. A market that has existed for over two decades beyond the purview of legality will soon be thrust into the maintstream, while states scramble to enact regulation to pave the way for bet-taking and bet-making within their respective borders. Estimates of the new industry vary, often ranging from $5b to $150b, and likely vary depending on the scope of the term ‘industry’. Broadly, the new betting industry will of course include total wagers within the sportsbook, but there will be countless opportunity for revenues from ancilliary services. I picture ESPN developing four or five new shows from scratch (or even a whole new channel), dedicated to providing casual bettor information, like point spreads and detailed game-day weather forecasts. Advertisers will be pouring money into securing space on the landing pages of sportsbook websites. And third-party data services will be competing to provide bleeding-edge insights, for a fee, to anyone trying to find an edge over the house.
While all of this news is supremely exciting, it couldn’t happen at a less exciting time; the arduous summer months of baseball-only action.
The NFL is 4 months out, and by the time states get their affairs in order to formally allow sports wagering, NHL and NBA will be just wrapping up their championship series’.
Despite my disappointment, I’m going to be taking a look at MLB trends and see if there’s anything we leverage to make better bets in our casual (or not so casual) wagering.
If you’d like to follow my work as it progresses, you can find the project on my GitHub here: https://github.com/Tucker-Allen/MLB_Predictions
MLB’s Strange Laze Faire Stadium Attitude
Of the four major professional sports popular to the US (football, basketball, hockey and baseball), only one of them has relaxed definitions of the playing field. In any MLB stadium, while the infield dimensions are stringently regulated, the outfield space is really up to the imagination of the stadium designer (so long as the foul lines are kept straight). Andrew Clem has a great visualization of this stadium-to-stadium variation here.
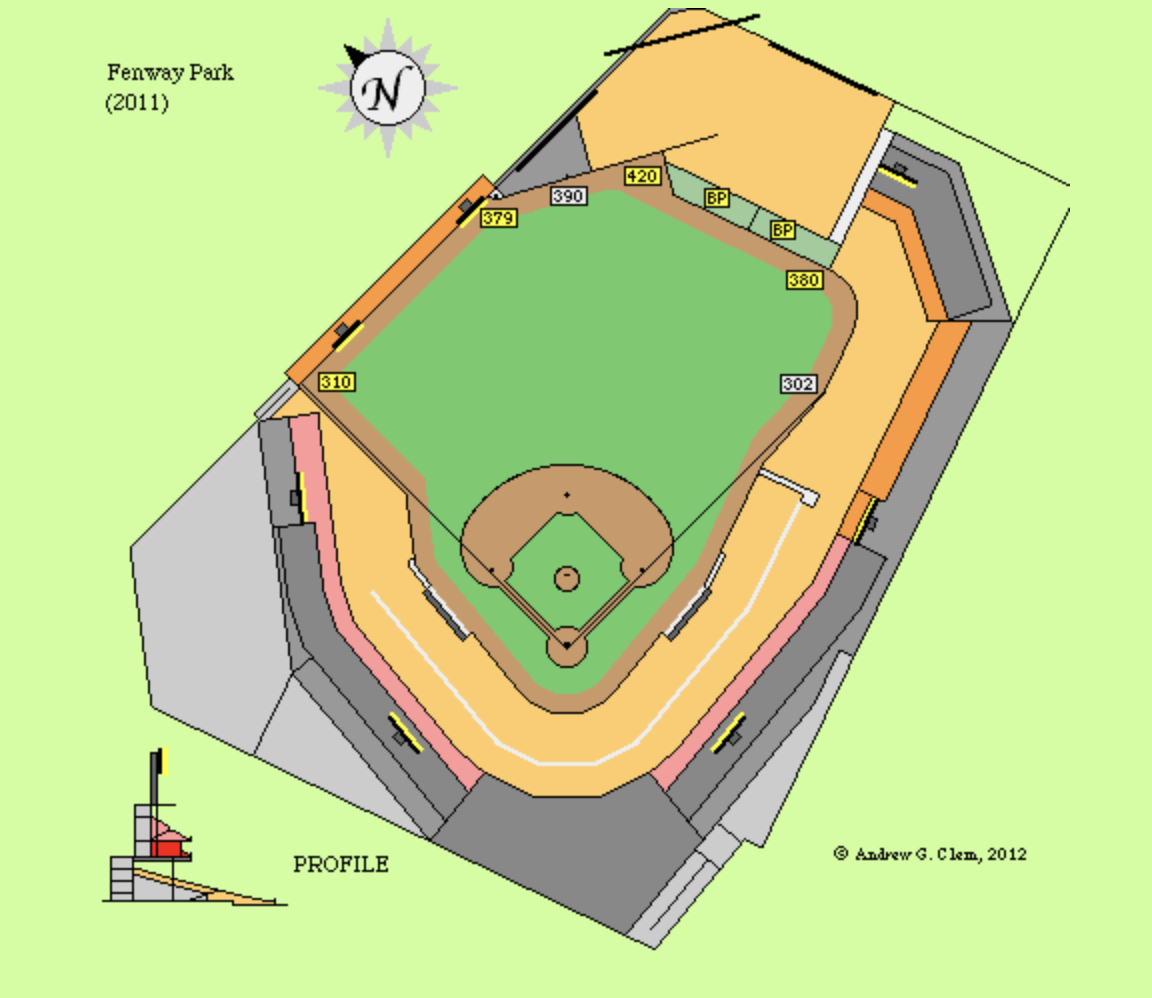
And all this variation in size and shape of outfield means that the total space that the same three outfielders have to cover can vary by as much as 14,400 ft^2! That’s equivalent to a 120’ x 120’ (or 40yd x 40yd) square. That’s nearly 1/3 of a football field!
Stats Overview from the 2017 season to today (as of 05/14/18):
Batting
- Games Played: 2,909
- Batting Average, all players: 0.254
- Batting Average, home team: 0.259
- Batting Average, away team: 0.249
Stadiums
- Min. Outfield Space: 83,500 ft^2
- Max. Outfield Space: 97,900 ft^2
- Min. Distance to LF: 310’
- Max. Distance to LF: 355’
- Min. Distance to CF: 390’
- Max. Distance to CF: 420’
- Min. Distance to RF: 302’
- Max. Distance to RF: 353’
How stadiums can affect batting performance becomes clearer when you look at batting performance at each individual stadium…
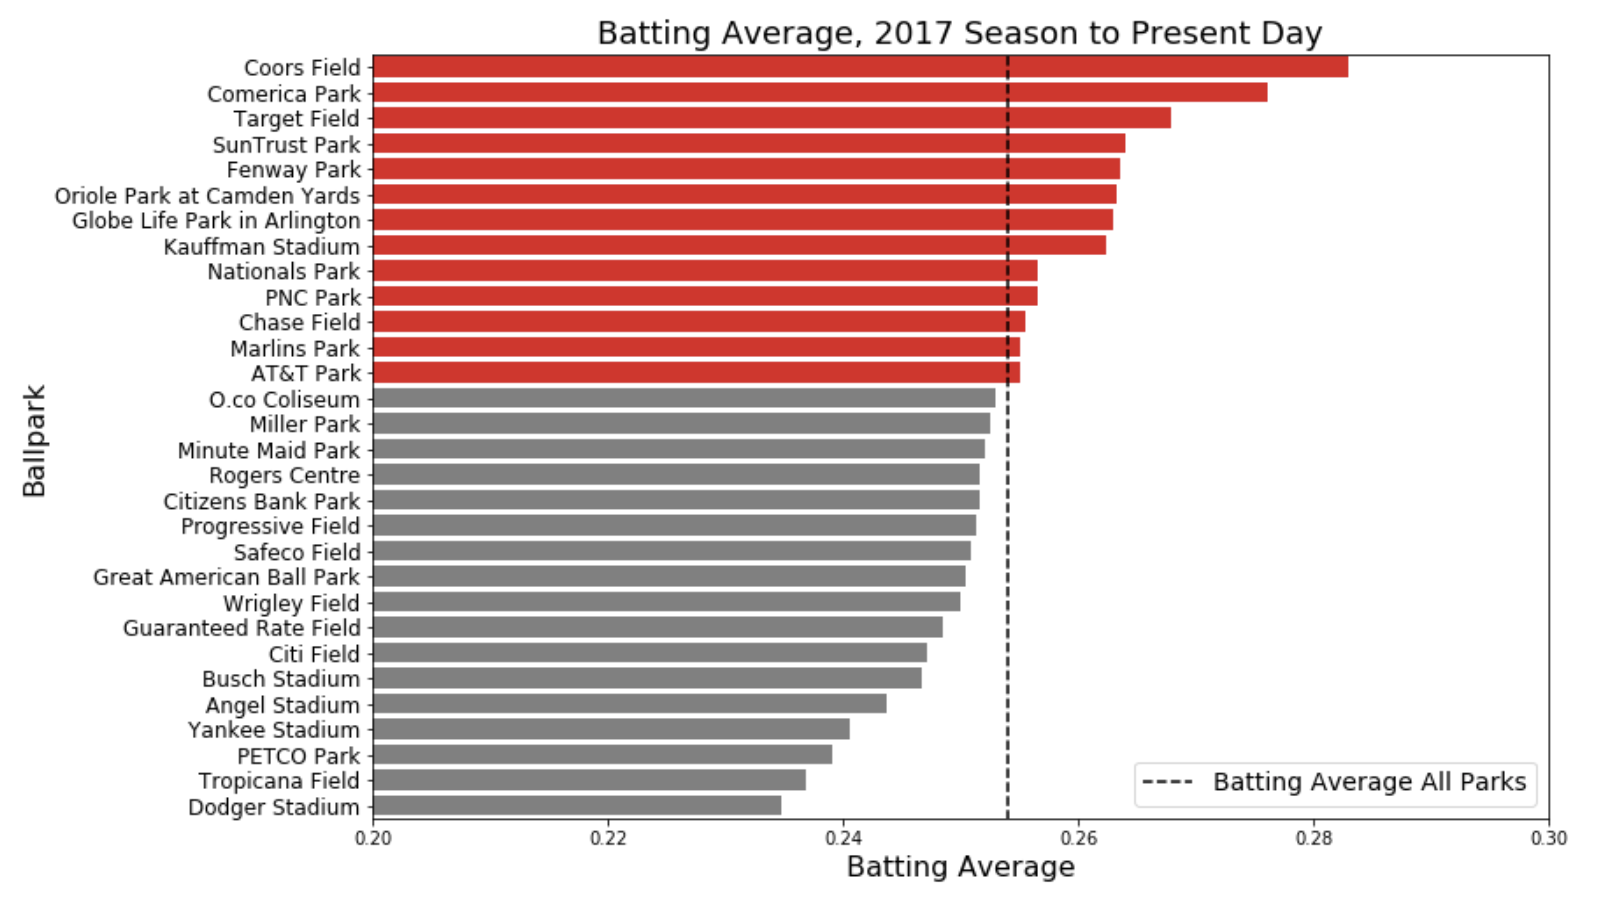
Now, this variation isn’t necessarily attributable solely to the stadium. Teams will play at their ‘home’ stadium more often than any other team, so better-hitting teams will have a disproportionate affect on the hitting average at their stadium.
So instead, we can look at the number of hits we would expect a team to hit at a given stadium, given their number of At-Bats that game and long-run average, then take a look at the +/- of ‘Expected Hits’
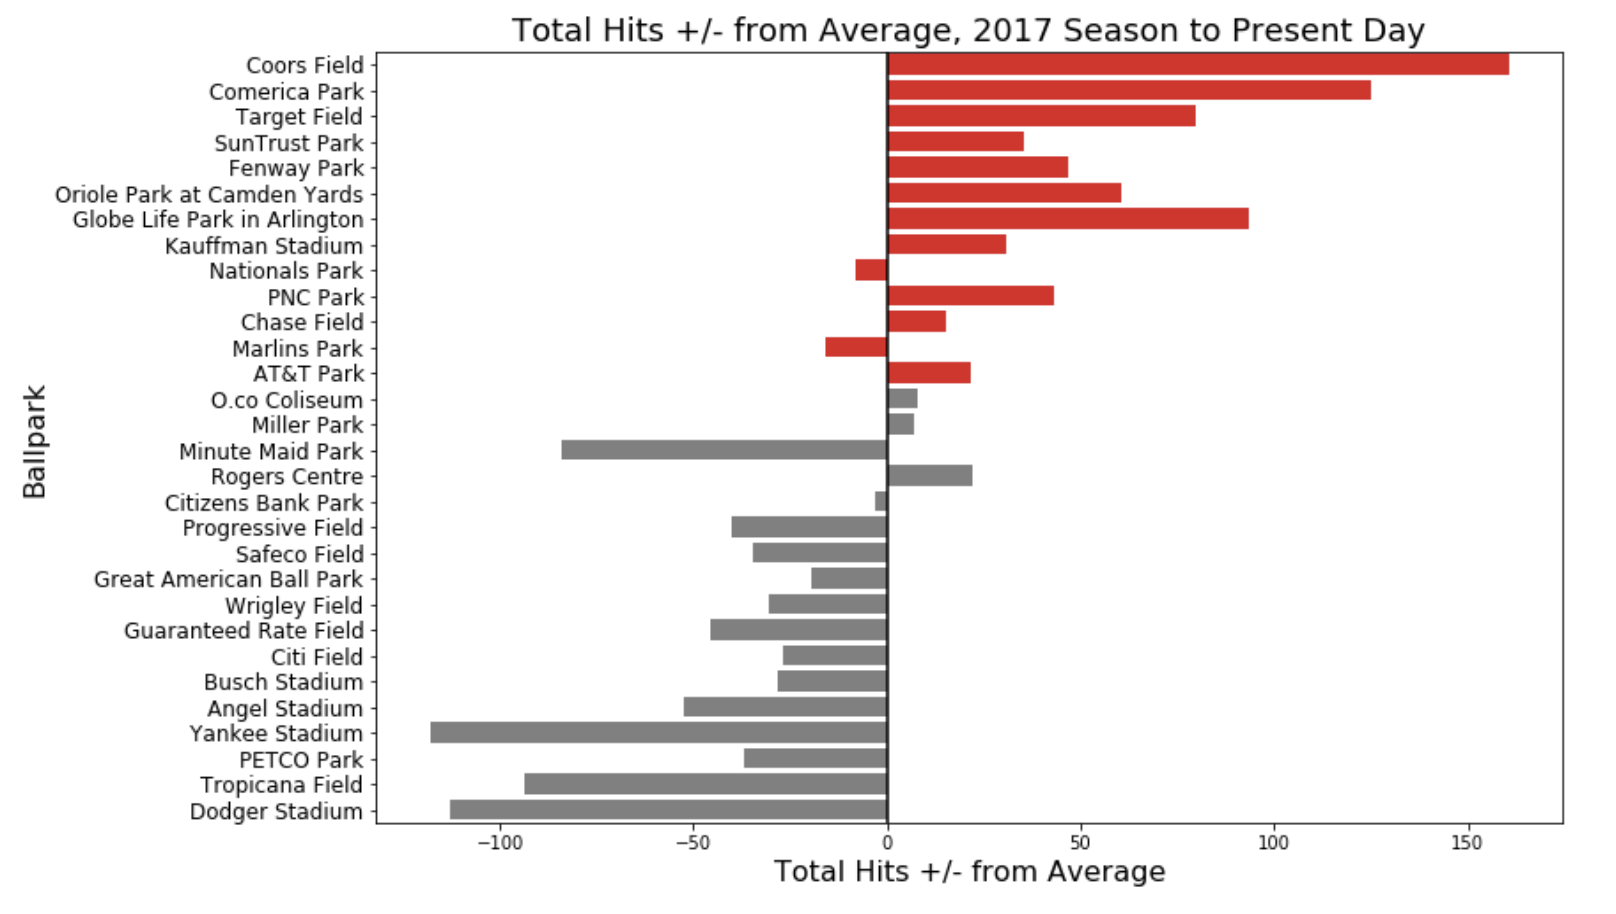
Now we can see that there is some serious evidence that the stadium alone can have a substantial impact on hitting performance. But how can this be? Is the variation in outfield space the culprit behind it? Or something else? Let’s look at a few more factors that can define the physical setting of the game:
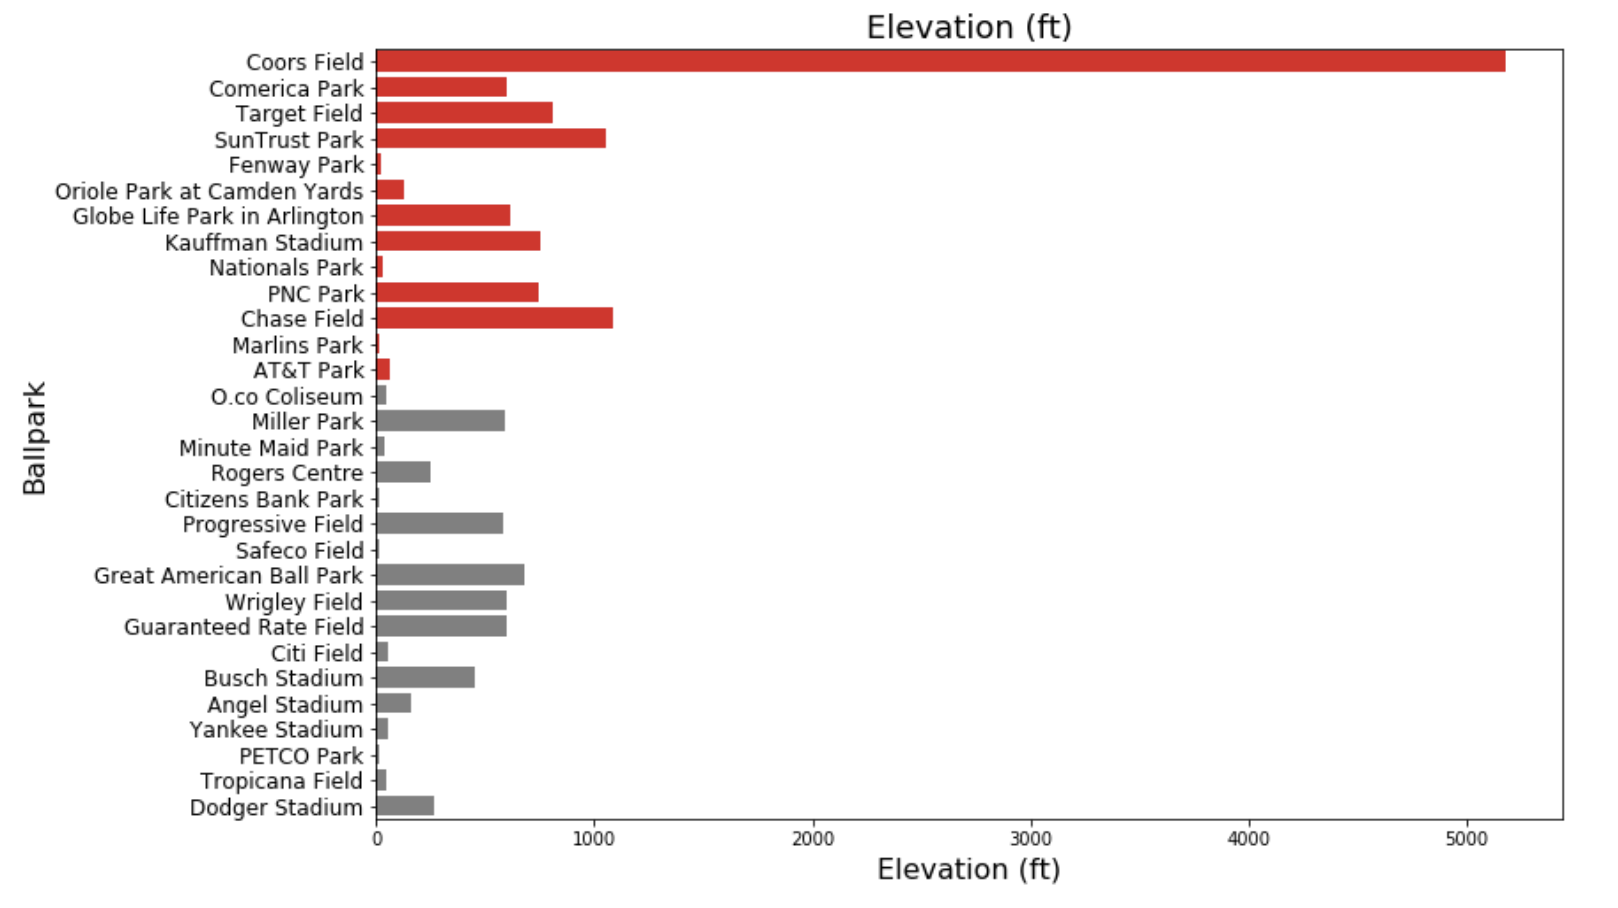
So games at Coors Field are practically played on the moon. Otherwise, it does appear that some of the higher-elevation stadiums yield better-than-average hitting performance.
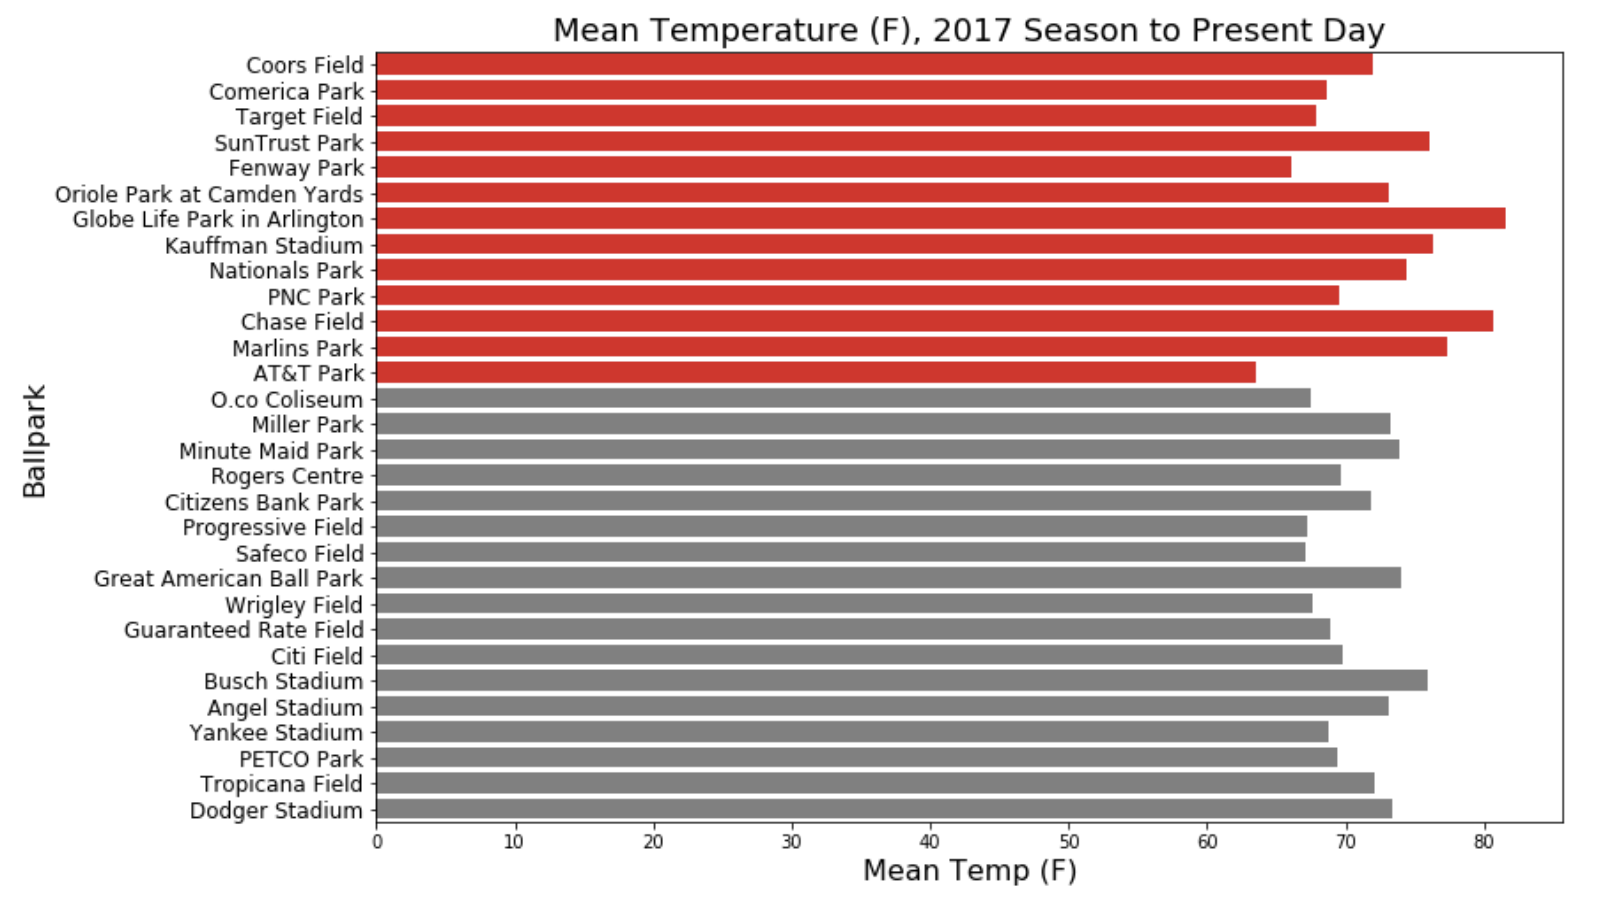
There doesn’t seem to be any kind of trend here strictly between temperature and hitting performance. However…
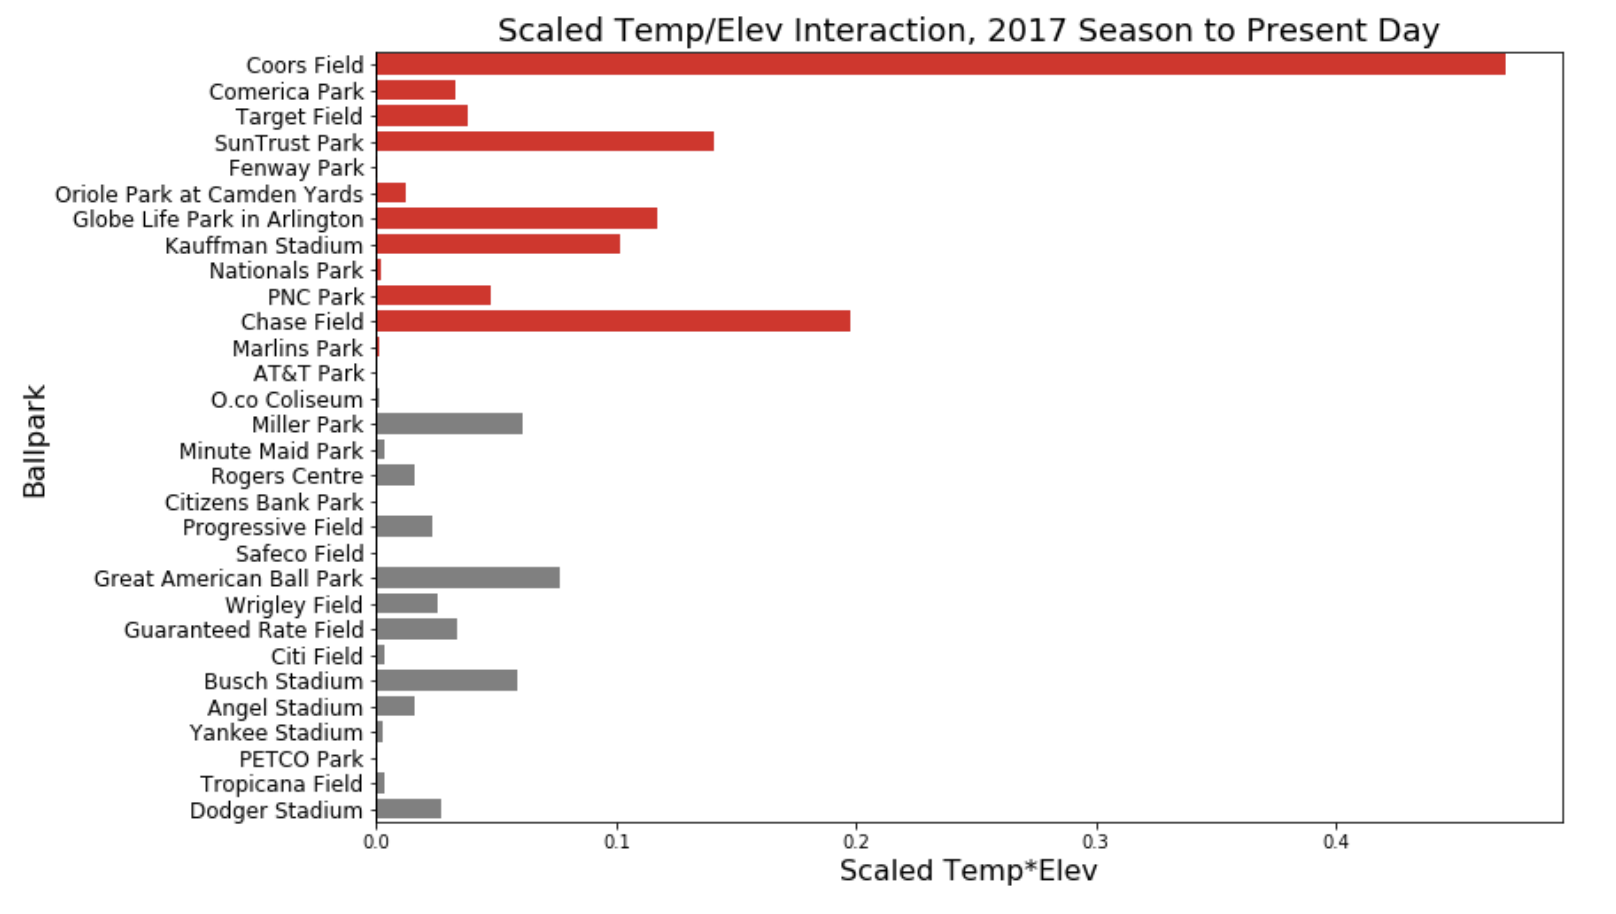
If you scale the mean temperature and elevation, and create a multiplicative interaction feature between them, a more obvious trend appears to emerge. This excercise was not blind luck, but informed by some great insight of the relationship between pitcher ball movement, and the Air Density Index (ADI). The ADI is a property of both elevation and temperature, which is tracked and described in great detail by the folks here: https://www.baseballvmi.com/fantasy-baseball-index-sports-weather.
Ultimately, the maximum amount of movement that a pitcher can apply to a baseball via curveballs or sliders is limited by the properties of the air that the baseball travels through, specifically the air density. And air density is most heavily governed by elevation and temperature. What this boils down to, is that the same curveball that yields 9” of total displacement in one enviornment, will only yield 4” of total displacement in another, a huge advantage to the batter in the latter environment.
Conclusion
The best predictive model will be one that is provided data that most completely reflects the underlying cause of variation in game-to-game outcomes. After some exploration of the impact of stadiums on hitting performance, I am convinced that not only will home/away data increase the performance of my eventual model, but also by defining the specific stadium that the game is played in. Stay tuned for Part II, when I study to what degree we can rely on past performance to predict future results.
Thanks for reading!
photo source: www.pexels.com